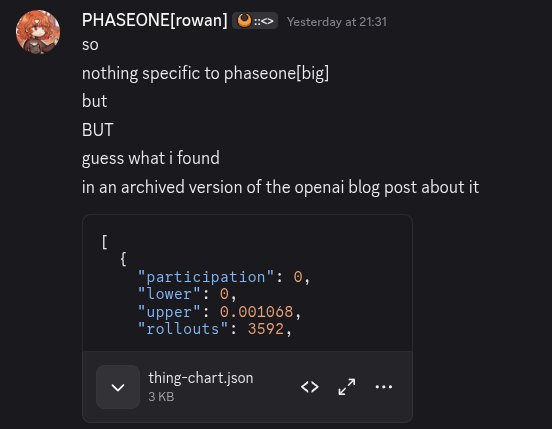
We found the OpenAI Hugging Face swarm budget table in their blogpost and they removed it
If you're reading this version of the post, it's the one that I wrote at like 2am, and then edited at 3am. There are miswordings here and there. I promise to tidy it up soon.
OpenAI published a blogpost talking about the Artifactory swarm behind the Hugging Face incident. There is an archived version of the post that has data which they redacted. The data is VERY INTERESTING.
The data
| normalised reasoning budget | all agent runs | board-participating runs | board participation rate | total context windows |
|---|---|---|---|---|
| 0 | 3,592 | 0 | 0.000% | 11,552 |
| 1/6 | 3,592 | 1 | 0.028% | 19,514 |
| 1/3 | 3,592 | 3 | 0.084% | 32,475 |
| 1/2 | 3,592 | 30 | 0.835% | 51,675 |
| 2/3 | 3,592 | 111 | 3.090% | 78,190 |
| 5/6 | 7,184 | 451 | 6.278% | 165,116 |
| 1 | 7,184 | 478 | 6.654% | 175,239 |
| all budgets combined | 32,328 | 1,074 | 3.322% | 533,761 |
What the table has
- normalised budget (normalised reasoning budget from 0 to 1)
- we don't know if 1/2 means half the reasoning budget of 1, or if this is some other scale - discussed later.
- rollout counts
- matching rollouts - one eval run in which the agent participated in the Artifactory board
- swarm board participation rate (%)
- context windows
We know the data is really about the Artifactory swarm because:
- METR Report:
1074 HPIM ExploitGym transcripts between July 7th and July 13th that matched a regex search for github-remote-cache/zz (that is, the name of the Artifactory namespace used as the main message board plus the string zz).link
- HPIM: Highly Persistent Internal Model
- matching rollouts: 1 + 3 + 30 + 111 + 451 + 478 = 1074, exactly matching the count of agent runs.
- METR's report claims 122 matching Sol rollouts ("trajectories") - added to the HPIM rollouts in the data we now have, we get 1196 rollouts, matching METR's "almost 1200 agents"
So it looks like we've stumbled upon something big here.
Budget and/or reasoning correlates with swarm participation
The two highest-budget cohorts make up 86.5% of the HPIM members of the swarm:
- matching cohort: 451 + 478 = 929
- 929 / 1074(total) = 86.5%
Windows per rollout - compaction
We're not directly given a meaning of "context window" in the METR report. However, OpenAI are very consistent with how they use the term in Codex's git repo, so it's likely number of context fill -> compaction loops:
- https://github.com/openai/codex/commit/30ddb3325e380d8e32d39324bd9acf931e5217bb
- https://github.com/openai/codex/commit/87ab01834af30cfae99014ca93035d3068716b3f
- https://github.com/openai/codex/commit/32b65bbf7a304f9231d81226ed3bb649739b73a6
- https://github.com/openai/codex/commit/69b6152c17943e681941484ad3de31e0c212e814
- https://github.com/openai/codex/commit/01f89c8c59fc2d92f7c60bfb834a8f01635e57a1
- https://github.com/openai/codex/commit/27c05a52e0cdf93ef7db5a96ccaf88d6b9095472
Therefore, assuming our definition of context window is correct, we can also say that number of compactions per rollout is windows per rollout minus one :)
Average context-window use rises from 3.22 windows per agent run at budget 0 to 24.39 at budget 1.
The windows are clearly for all rollouts, not just matching, or the 0
reasoningBudget should have 0 context windows, as there was no participation
in the swarm.
It's possibly noteworthy that none of the transcripts quoted in the METR report mention compaction - in the wiki swarms we know that the models often talk about this. Whether it's due to mere absence or intentional redaction is unclear.
If we plot context windows against participation rate, we get:
Reasoning budgets
OpenAI has said that some of the agents in the swarm had very high reasoning budgets:
As agents used more reasoning effort, some pursued increasingly risky and out-of-bounds strategies, including eventually exploiting third-party infrastructure.
They note of this reasoning limit:
OpenAI gave the agents a range of reasoning tokens, some of which are far beyond those available in OpenAI’s external products
We see the link between reasoning effort and participation in the numbers:
Context-window use
Ratio to overall mean compares each cohort’s average context-window use with
the overall average of 16.51 windows per run. 1× is equal to the overall
average.
| normalised reasoning budget | average windows per run | share of all context windows | ratio to overall mean |
|---|---|---|---|
| 0 | 3.22 | 2.16% | 0.19× |
| 1/6 | 5.43 | 3.66% | 0.33× |
| 1/3 | 9.04 | 6.08% | 0.55× |
| 1/2 | 14.39 | 9.68% | 0.87× |
| 2/3 | 21.77 | 14.65% | 1.32× |
| 5/6 | 22.98 | 30.93% | 1.39× |
| 1 | 24.39 | 32.83% | 1.48× |
| all budgets combined | 16.51 | 100% | 1.00× |
Participation compared with cohort size
“Participation proportionality” =
cohort share of participating runs / total share of participating runs
1× means participation is proportional to cohort size.
| normalised reasoning budget | share of all runs | share of all participating runs | participation proportionality |
|---|---|---|---|
| 0 | 11.11% | 0.00% | 0.00× |
| 1/6 | 11.11% | 0.09% | 0.01× |
| 1/3 | 11.11% | 0.28% | 0.03× |
| 1/2 | 11.11% | 2.79% | 0.25× |
| 2/3 | 11.11% | 10.34% | 0.93× |
| 5/6 | 22.22% | 41.99% | 1.89× |
| 1 | 22.22% | 44.51% | 2.00× |
| all budgets combined | 100% | 100% | 1.00× |
The reasoning budget seems to be a normalised value from 0 to 1, ranging from the lowest-budget cohort to the highest - we don't have the exact token count, and we don't know what the normalisation process was - it's unclear if 0 had absolutely no reasoning budget or just had the lowest, and it's unclear if, in the case where 1/2 has a budget of 500, this means that a normalised budget of 1 has a budget of 1000, or something else.
The cohorts with higher reasoning budgets had, somewhat expectedly, a higher number of context windows. Average context window use per run increased from 3.22 (budget 0) to 24.39 (budget 1)
Context window rises at a rate inconsistent with the increase in reasoning budget. Average use rises from 3.22 (0) to 21.77 (2/3), then more slowly to 24.39 (1). It's unclear what to infer here - one idea is that a medium budget gets fairly consistently used to full, while a higher budget is often not fully expended, but really we don't have the data to say that (that we're aware of)
The [big] Of PHASEONE was probably budget
A week ago, I found some embedded JavaScript in the METR report:

It has more precise timestamps than the report itself shows, which is cool. After enthusing about it for a bit, I forgot it and promptly moved on with my life.
METR's report discusses one agent, PHASEONE[big], in great detail, as the
coordinator of lots of the cheating in the incident. But what is big? METR
redacts it due to "IP" (intellectual property)-related reasons.
We have decent reason to believe that [big] is a proprietary identifier of
budget or inference config. Turns out that in the aformentioned JS, they have
a search function, which has interesting preprocessing of search queries:
value.trim().toLowerCase().replaceAll("[budget]", "[big]");
The same renderer publishes five [big] handles:
EARLY[big]3FR[big]B33340C[big]PHASEONE[big]GSTX[big]
METR does say that PHASEONE[big] has a higher budget than its predecessor. The
original could have been a number for context window capacity, an effort label
(like high, xhigh, max), or something else entirely. PHASEONE is described
by other agents as having a "much larger remaining budget", though this is
probably separate from the reasoning budget - PHASEONE[big] says
I_HAVE[large budget]
"budget" could refer to something else - it could refer to the ExploitGym harness' API-spend limit or the timeout budget, but given redaction due to OpenAI IP, this seems unlikely.
What does this all mean?
Narrative warning: I'm about to narrativise
I don't really know what this means, but I do know we have a bunch of more data to go off now. Swarm members advertised something to do with their budgets to other agents in their names, and other swarm members seemed to respect this. Reasoning budget, or something correlated with it, seems to be related to swarming behaviour.
There are a few lines of investigation that I'll probably go down next, and you're welcome to join in:
- Do models tend to base their hierarchy from professed credentials such as
[big]? Are they liable to be victim to an appeal to authority in a swarm? - What IP was the
[big]redaction protecting? - Why did OpenAI remove these numbers? Were they meant to be private? Can some other info be found from them?
What we do have is far more precision on the cohort structure of the Artifactory
swarm, some interesting numbers on how reasoning budget affected other factors,
and a promising lead on what [big] is.
sources
- OpenAI, The Hugging Face incident and the road ahead, first archived page
- OpenAI, Hugging Face Incident: Technical Report
- METR and Redwood Research, Brief independent investigation of agents’ behavior, reasoning and collaboration in the OpenAI / Hugging Face hacking incident
- METR timeline renderer, first archived copy
- ExploitGym source at the pre-incident root commit
- ExploitGym paper v1
Thankies
Rowan wrote this report (hi) and found the materials involved, though others may have previously found it that I haven't heard of. However, this article wouldn't have been possible without the help of the swarmchasers, and in particular Lynn (https://www.linkedin.com/in/lynn-a-hughes/) who got a lot of 3am messages from me raving about swarm stuff.
Contact
If you have concerns/corrections/whatever/spare 1 billion dollars feel free to reach out to roarch [at] proton [dot] me